Links
Manual
Preface
On-line manual and other resources are provided to explain the background and use of the SPARK MD simulation progam together with key connections within the broader integrated molecular and materials processes characterization environment.
The SPARK-MD program is currently under initial development, meaning that it is likely to undergo rapid changes in most parts. The current focus is to prioritize improving the simulation capabilities as rapidly as possible over concerns to maintain backwards compatibility. As a good practice it is highly recommended to keep an accurate data record of all work, in particular using date-stamps for executables, inputs and outputs to allow facilie tracking of results.
All on-line material is currently available for free for testing and inspection, and all constructive feedback is very welcome.
1. Introduction
2. Molecular Dynamics Simulations
Input Files
Running a basic SPARK MD simulation requires a program executable (typically spark) that can access the input from four main input files: mol.inp, mol.xyz, mol.ff, and Periodic_Table.csv. The Periodic_Table.csv file contains basic atomic data, e.g. atomic mass, that normally does not have to be changed to run a simulation. Thus, to set up an MD simulation typically involves setting up or modifying existing version of the files mol.inp, mol.xyz, and mol.ff.Once suitable input files have been constructed, the MD simulation can be run as ./spark > filename.out which generates several output files including the filename.out output file as well as separate trajectory files for structures (trj.xyz) and energy as function of time (trj_tE.csv).
mol.inp
The MD simulations are largely controlled by a number of parameters with default values that can be modified as line items in the mol.inp file.| Keyword | Type | Default | Options | Comment |
|---|---|---|---|---|
| # | Comment | |||
| system | int | 0: Single Point | Atomistic Cell | |
| runtype | int | 0 | 1: Opt, 2: MD | |
| simulation | int | 1: NVT | 0: NVE | |
| timesteps | int | 10000 | ||
| timestep | double | 0.01 | unit: fs | |
| trj_freq_update | int | 100 | ||
| start_velocity | double | 0.01 | unit: A/fs | |
| temperature | double | 300.0 | unit: K | |
| temp_response | double | 0.0001 | T equilibration rate. unit: K/fs | |
| cell_boundaries | 6 * double | 3*(-10.0,10.0) | unit: A |
mol.xyz
Atomic coordinates in simple csv-format with one atom per line (N,x,y,z).Example: CO
C, 0.00, 0.00, 0.00
O, 0.00, 0.00, 1.20
mol.ff
Force Field specifying inter-atomic interactions (bonds, angles, dihedrals, etc).Each line provides text-based information in csv-format about one force term according to a standard format with an ID, a list of objects and a list of associated parameters. Currently takes up to 8 objects and 12 parameters for each force specification.
ID, [objects], [parameters]
Example
Output Files
filename.out
Direct output reporting on progress of SPARK MD simulation in plain text format.REMARKS:
1. NOTICE: This file is overwritten during restarts specifying the same output filename.
2. NOTICE: This file can get extremely large for long simulations as it currently by default displays key information for each MD cycle.
trj.xyz
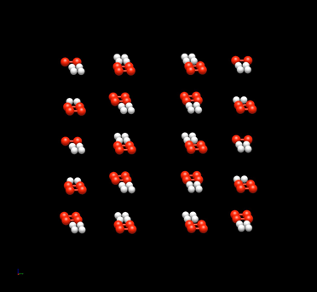
The structural dynamics is captured in the trajectory file trj.xyz containing a series of atomic structures in simple Nxyz that can be visualized graphically using widely available molecule viewing software such as Avogadro (open file and select Extensions->Animation).trj_tE.csv
The trj_tE.csv file details the simulation trajectory in terms of energy as a function of time. The data is collected in a csv format in which the first column lists the simulation time, the following several colums list different energy terms (bonds, angles, dihedrals, kinetic, etc as available) and the final column lists the total energy for each timestep.The data output in the trj_tE.csv file can displayed in various ways including using dedicated Jupyter Notebooks or third party plotting and spreadsheet programs.
3. Hybrid Quantum-Classical Molecular Dynamics
The SPARK MD simulations are designed from the ground up to facilitate hybrid QM-MD simulations. This includes using QM calculations to support QM-compatible force field (FF) development (see FF parameterization documentation), as well as calculation of QM-derived properties such as charges, electronic structure, spectroscopic properties on MD-generated trajectories.4. Files
5. Force Field